
The European Quality of Government Index (EQI) is the result novel survey data on corruption and governance at the regional level within the EU, conducted in first in 2010 and then again in 2013 and in 2017. The data focus on both perceptions and experiences with public sector corruption, along with the extent to which citizens believe various public sector services are impartially allocated and of good quality. The 2010 and 2017 rounds of the projet have been funded by the EU Commission for Regional Development (REGIO). The 2013 round, funded by the EU Commission’s 7th Annual Framework Project and is included in ANTICORP, a large research consortium on anti-corruption. It is the first source of data to date that allows researchers to compare QoG within and across countries in such a multi-country context.
It covers all 28 member states, two accession countries for 2013 (Serbia and Turkey). The sub-national regions are at the NUTS 1 or NUTS 2 level, depending on the country.
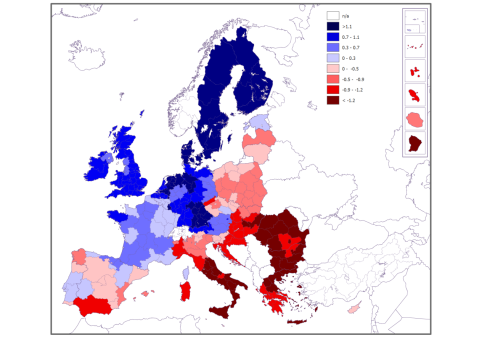
For 2010, the EQI contains 172 regions based on a survey that was answered by 34 000 citizen respondents. For 2013, the EQI has been expanded to 206 regions based on a survey that was answered by 85 000 citizen respondents, which is the largest sub-nationally-focused survey on QoG to date. The 2017 round includes 202 regions from a survey of 78,000 citizens. The data is standardized with a mean of zero, and higher scores implying higher QoG.
2017 EQI
User Use of the EQI
The latest full data for both years can be accessed here in Excel: EQI data QoG webpage. Please note that for purposes of comparability across the two years, the data from 2010 and 2013 have been retrospectively changed (slightly) to make them comprable with 2017. The changes have been made mainly to increase the relevance of the three pillars of the index – corruption, impartiality and quality. For more information on the changes, see Charron and Lapuente (2018).
For a more in depth description of the EQI 2010 data: Regional Studies Article. For those interested in even more information, please see our book publication
For a more in depth description of the EQI 2013 data: Social Indicators Research article (regional level analysis) and Book chapter (national level summary)
For those interested in the sensitivity test of the World Bank’s Governance Indicators (Kaufman et al 2009) used for national level estimates of the EQI: WGI Sensitity Tests
The latest survey (from 2013) on which the regional level data is built can be found here: 2013 EQI Survey Questions
2017 EQI survey Questions
**For those interested in the micro (indivdiual) level data used to construct the EQI, you may download 2010 and 2013 here (2017 coming soon!):
We kindly ask you to use the following references when using/citing the 2010 EQI data:
Charron, Nicholas, Lewis Dijkstra & Victor Lapuente. 2014. ‘Regional Governance Matters: Quality of Government within European Union Member States’, Regional Studies, 48(1): 68-90.
The reference for the 2013 EQI data is the following:
Charron, Nicholas, Lewis Dijkstra and Victor Lapuente. 2015. ‘Mapping the Regional Divide in Europe: A Measure for Assessing Quality of Government in 206 European Regions’. Social Indicators Research. vol 122 (2): 315-346.
The reference for the 2017 EQI data is the following:
